Canada
Visualcap is a Canada-based data visualization channel that translates complex economic and financial data into chart-driven content for a general but analytically minded audience.
Total Followers +0.2%
509K
Across YouTube, Instagram, TikTok
Primary Platform
YouTube
95K followers · 19% of audience
Engagement
2.7%
vs. 1.5% category median
Sponsorship Tier
Mid
Est. $6.2K–$14K / IG post
| Window | YouTube | TikTok | Combined | |
|---|---|---|---|---|
| Last 7 days | +0 +0.0% | +207 +0.1% | +2 +0.4% | +209 |
| Last 30 days | +0 +0.0% | +910 +0.2% | +3 +0.6% | +913 |
| Last 90 days | +105 +0.1% | +4K +0.9% | +29 +5.9% | +4K |
| Last 365 days | +105 +0.1% | +4K +0.9% | +29 +5.9% | +4K |
Daily follower snapshots from CreatorDB's longitudinal index.
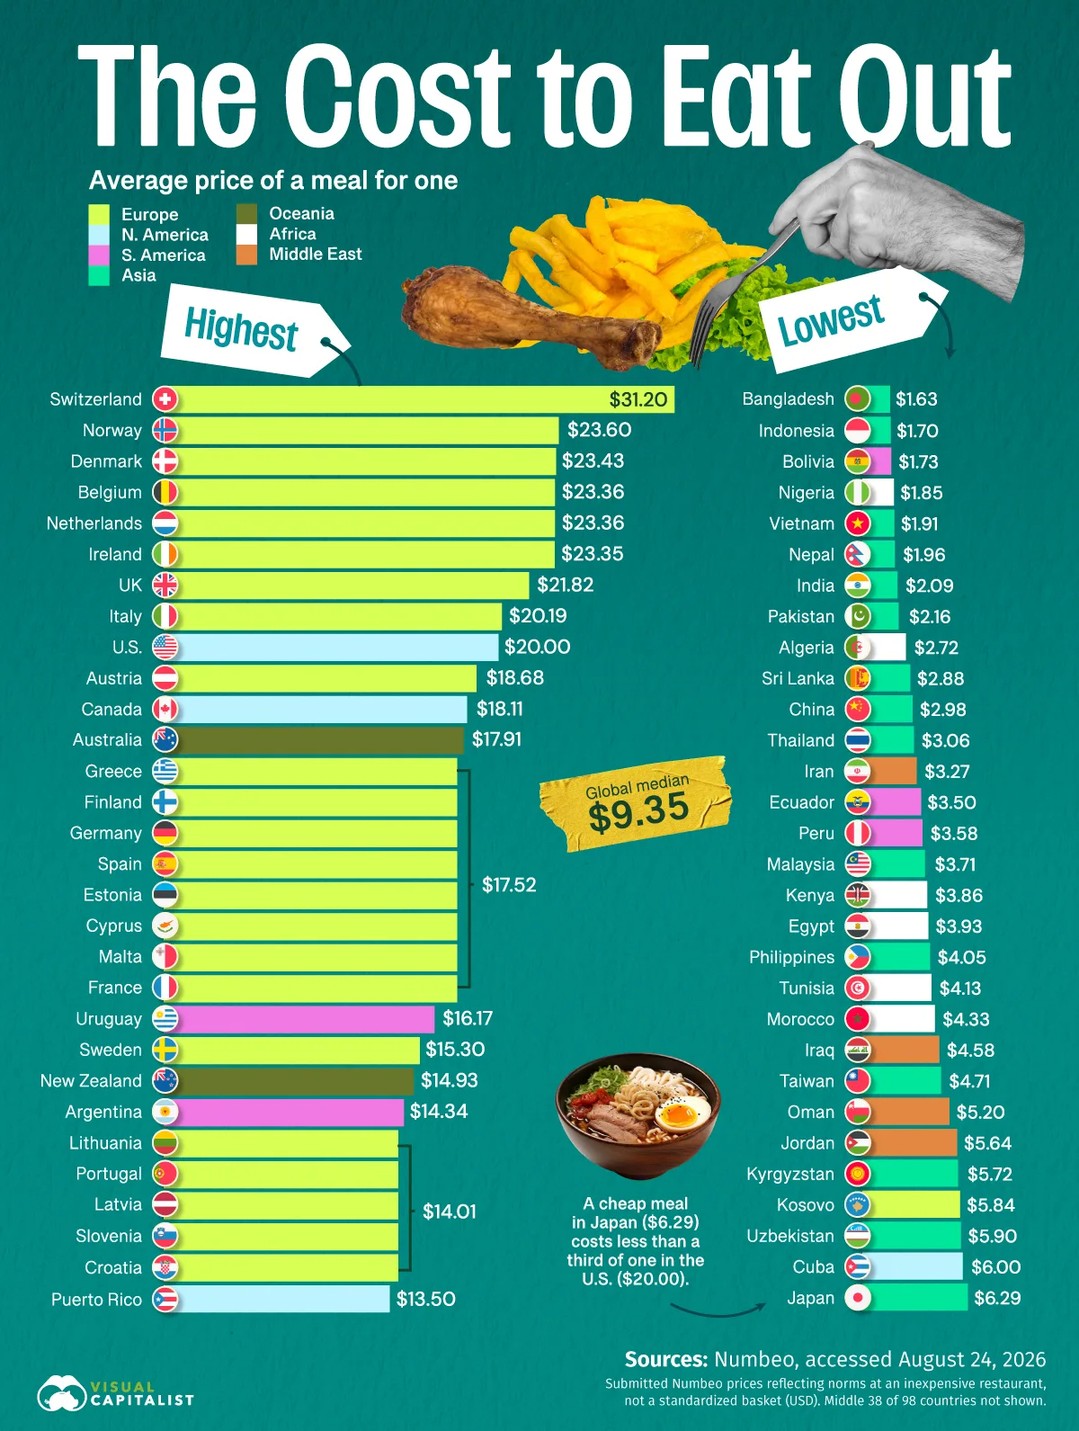
Visualcap is a Canada-based data visualization channel that translates complex economic and financial data into chart-driven content for a general but analytically minded audience. Its posts cover topics like global debt, fertility trends, interest rates, GDP, and emerging technology — framed as visual narratives rather than traditional commentary. The channel is affiliated with Voronoi, a data visualization platform, which provides institutional credibility and dataset access that distinguishes it from solo finance creators. Instagram is currently its most active publishing home, with YouTube and TikTok seeing considerably less recent output.
The audience is predominantly male and older-skewing, with a substantial concentration of followers aged 35 and above — demographics that map naturally to financial services, investment platforms, and economic research brands. Engagement sits meaningfully above the category median, indicating a genuinely curious following rather than passive subscribers accumulated through algorithmic spikes. That audience profile, combined with the Voronoi affiliation, positions Visualcap as a credible vehicle for fintech companies, data-intelligence tools, and macro-focused media brands. Its trajectory will hinge on whether it consolidates its cross-platform identity into a consistent cadence on Instagram, where the bulk of its active, high-intent readership now resides.
Visualcap reaches an audience concentrated in Canada primarily through YouTube, and is best activated via long-form YouTube integrations, Instagram Reels and Stories, TikTok branded content. Their sponsorship history skews toward Data / Technology, a clear signal of fit for brands in those categories. Demonstrated partners include Voronoi App. Engagement on YouTube runs around 2.7%, which points to an audience better suited to category-relevant, mid-funnel campaigns than to pure-reach buys. The channel's mix of long-form YouTube integrations and Instagram Reels and Stories lets a sponsor choose between short awareness placements and longer, more detailed integrations. Because the audience follows education content rather than arriving through untargeted reach, sponsorships that match the channel's subject matter tend to convert more efficiently than broad placements. A consistent, on-topic posting focus gives sponsors a predictable, brand-safe environment, lowering placement risk compared with broad, general-interest channels. Campaigns here are best measured on qualified engagement and consideration within the niche rather than on raw impression volume. For Canada-focused brands in Data / Technology and related categories, Visualcap offers a defined, creative-fit audience rather than broad, low-intent impressions.
Benchmark estimates for a creator at Visualcap's tier (Mid, 509K combined followers, Canada). Pulled from CreatorDB's category benchmarks.
The CreatorDB Agency runs end-to-end influencer campaigns globally — shortlisting, outreach, contracting, and performance reporting. Talk to our team about building a campaign around creators in this niche.
Voronoi is a data visualization platform, and Visualcap lists themselves as an official creator on the app in their Instagram bio. This suggests their charts and infographics are distributed through Voronoi alongside their own social channels, giving their data-driven content an additional dedicated home. It's one of the clearest signals that Visualcap operates within a broader data-visualization media ecosystem rather than as a purely independent creator.
As of mid-2026, Visualcap's YouTube channel had gone well over a year without a new upload, while their Instagram remained actively updated on a near-daily basis. No public explanation was given for the pause, but their content strategy appears to have shifted toward feed-based visuals on Instagram rather than longer YouTube videos. Their Instagram following is several times larger than their YouTube subscriber base, which likely reinforces that platform priority.
Yes — hashtags like #tinder and #match appear among Visualcap's most-used tags, indicating they've produced data visualizations covering the online dating industry. This fits their broader format of turning surprising or counterintuitive datasets into shareable infographics. Dating app user trends, market size, or demographic shifts are the kind of angle their data snack style typically takes.
Global debt, interest rates, and GDP are core recurring topics for Visualcap, with #globaldebt, #debt, #interestrates, and #gdp all among their most-used hashtags. Their content frames these macroeconomic themes visually, making them accessible to a general audience rather than only finance professionals. It's part of why their follower base skews toward older, economically-engaged viewers.
Yes — one of their featured posts is titled "Charted: Sinking Fertility Rates in the World's 10 Largest Countries," a classic example of their format: taking a major demographic trend and presenting it through a clean, shareable visualization. Demographic and population topics sit alongside economy and technology as recurring themes in their content. Posts like this tend to perform well because the data tells a self-evident story without requiring narration.
Visualcap uses the phrase "data snacks" in their TikTok bio to describe their content philosophy — short, digestible visualizations that communicate a single data insight quickly. Rather than long explainer videos, the format is built to be consumed in seconds on a social feed. It's a positioning choice that separates them from traditional financial media and long-form data journalism.
Electric and hybrid vehicles, alongside environmental topics, appear in Visualcap's YouTube content classification, suggesting they've covered EV adoption rates, market growth, or related trends. This fits their broader tech-and-economy beat — EV data intersects both their investing angle and their future-of-technology framing. It's one of several topic verticals layered under their main economy and global-trends umbrella.
Visualcap's audience is heavily male — roughly four in five followers are men — and skews older than most creator audiences, with the largest segment being 45 and above. American viewers make up the clear majority, followed by audiences in Canada, the United Kingdom, India, and Australia. The demographic profile matches what you'd expect for data-driven content about investing, macroeconomics, and global trends.
As of 2026, Instagram is Visualcap's most active platform, with posts going up as frequently as daily and their largest follower base concentrated there. Their YouTube channel has been dormant for well over a year, and their TikTok presence remains minimal. The Instagram-first approach aligns with their infographic format, which performs strongly as a static post or Reel in a visual feed.
Visualcap is based in Canada, though the overwhelming majority of their audience — roughly two-thirds — is located in the United States. Their content covers global economic and technology trends without a strong regional focus, which likely explains why they've built a predominantly American viewership despite being a Canadian creator.
Stats (followers, engagement, audience demographics, growth) are pulled live from the CreatorDB API covering YouTube, Instagram and TikTok. Bio and FAQ content is AI-assisted; news items are sourced from cited public press at generation time. Read the full methodology →
If you'd like to update, correct, or remove this profile, get in touch and we'll handle it within 5 business days. We don't publish private data — every stat shown comes from your public platform profiles.
@visualcap · YouTube
+0 new followers
Preparing fresh data…
This usually takes 15–25 seconds.